
The digital publishing renaissance, elicited in part by the Information Age, was a sort of deus ex machina for traditional print publishers backed into an ever-tightening corner. On one hand, these publishers struggled to keep up with the demands of an increasingly digitizing industry. On the other, their struggle was concurrently a wake-up call for reformation. Then the unexpected happened. Print acknowledged digital as its compulsory offset and, instead of vying for the venerable title of best format, the two coalesced and worked in tandem to shape the industry we’ve come to appreciate today.
Central to this digital revolution was the ability for publishers to start monetizing their content for online audiences and, just as important, adapt a metric-based approach for evaluating their performance. Armed with a plethora of newfound knowledge, publishers were beginning to sell smarter and ameliorate their net profit margins.
Leveraging Sales Statistics with Joomag
It’s incredibly valuable information to know, which is why Joomag’s platform includes in-depth sales statistics for publishers. To access them, you’ll first need to sign into your Joomag account. Doing so will subsequently direct you to the “My Magazines” screen. From here, click on “Sales Statistics” (designated by the dollar sign icon) on the left toolbar.
You’ll see this screen next:
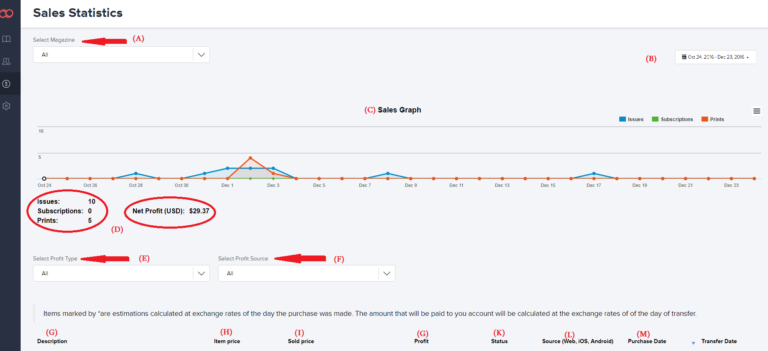
The “Select Magazine” (A) drop-down arrow will let you choose the magazine you want statistics for. The dates drop-down menu (B) allows you to specify a custom date range for your publication’s statistics.
The handy “Sales Graph” (C) provides a nice, clean visual for you to determine how well different versions of your publications are selling. The graph will automatically adjust according to your selected date range and display issues (in blue), subscriptions (green), and print copies (orange) sold. Below the graph are the numbers of issues, subscriptions, and print (D) copies sold individually. The net profit (USD) (D)represents the total amount of sales dollars remaining after we have deducted our commission fee.
The “Select Profit Type” (E) and “Select Profit Source” (F) categories will help you arrange your sold publications by their purchased format and application types, respectively.
-
Profit Type: arranges the chart according to all issues, single issues, subscriptions, or print orders sold.
-
Profit Source: arranges the chart according to the web, Android, iOS, or all applications sold.
Description (G): lists every publication that was sold. It also provides detailed information including the exact number of copies sold, issue number, format (digital or print), and print copy specifications (cover type, color, page formatting, binding, etc.).
Item price (H): the price the user paid for the publication or subscription.
Sold price (I): the price your publication was sold for. Purchases made from mobile devices can be listed in foreign currencies, which is why the “Sold price” is also displayed in the “Item price” column.
Profit (J): the exact amount of dollars earned from the sale.Status (K): shows the status of the transaction. Users can determine if there are funds remaining on their balances or if they have been transferred to their PayPal accounts
Source (L): lists which version of the publication was sold (web, iOS, or Android).
Purchase date (M): the exact date and time the publication was sold.
Transfer date (N): indicates the date when the funds for each transaction were transferred to the user’s PayPal account.
Conclusion: Embracing Data-Driven Success
Your sales figures denote your success as an online publisher in more ways than one. Not only do they specify how many dollars you’ve accumulated, but they can also speak volumes about the quality of your content, how good your marketing is, and what business trends are developing over specific periods of time. Joomag’s sales statistics will always be at the forefront of your publishing strategy, so use them wisely to forecast your future performance and make a killing off your content.
FAQ
1. Why are sales statistics important for digital publishers?
Sales statistics provide valuable insights into the performance of digital publications, including the number of copies sold, net profit margins, and trends in purchasing behavior. Publishers can use this data to make informed decisions about content creation, marketing strategies, and overall business growth.
2. How can I access sales statistics on Joomag's platform?
To access sales statistics on Joomag, log in to your account and navigate to the "My Magazines" screen. Click on "Sales Statistics" in the left toolbar. Here, you can select the specific magazine and date range for which you want to view statistics. The platform provides detailed graphs and data on issues sold, subscriptions, print copies, net profit, and more.
3. What insights can I gain from Joomag's sales statistics?
Joomag's sales statistics offer insights into various aspects of publication sales, including the performance of different publication versions (digital or print), pricing strategies, sales channels (web, iOS, Android), and transaction statuses. Publishers can analyze this data to optimize their sales strategies, improve content offerings, and maximize revenue potential.


