Everyone loves infographics. Why? To put it simply, they work. Here are 3 other good reasons:
-
We have really short attention spans and we’re flooded with information every day. That’s the perfect recipe for poor concentration. Infographics, however, can alleviate the problem by providing visual information that our brains process much faster than text.
-
Nearly half of all internet users spend less than 15 seconds looking at a web page. An eye-catching infographic can make every second (and more) count.
-
In the 50 seconds it takes to read 200-250 words, it only takes 1/10th of a second to process a visual image. Infographics present the most amount of info in the least amount of time.
Must-See Publishing Infographics
Convinced yet? We sure are, which is why we’ve scoured the internet for the top 3 publishing infographics every publisher (both digital and print) needs to see. Look at them, learn from them, and–most importantly– leverage them to refine your craft.
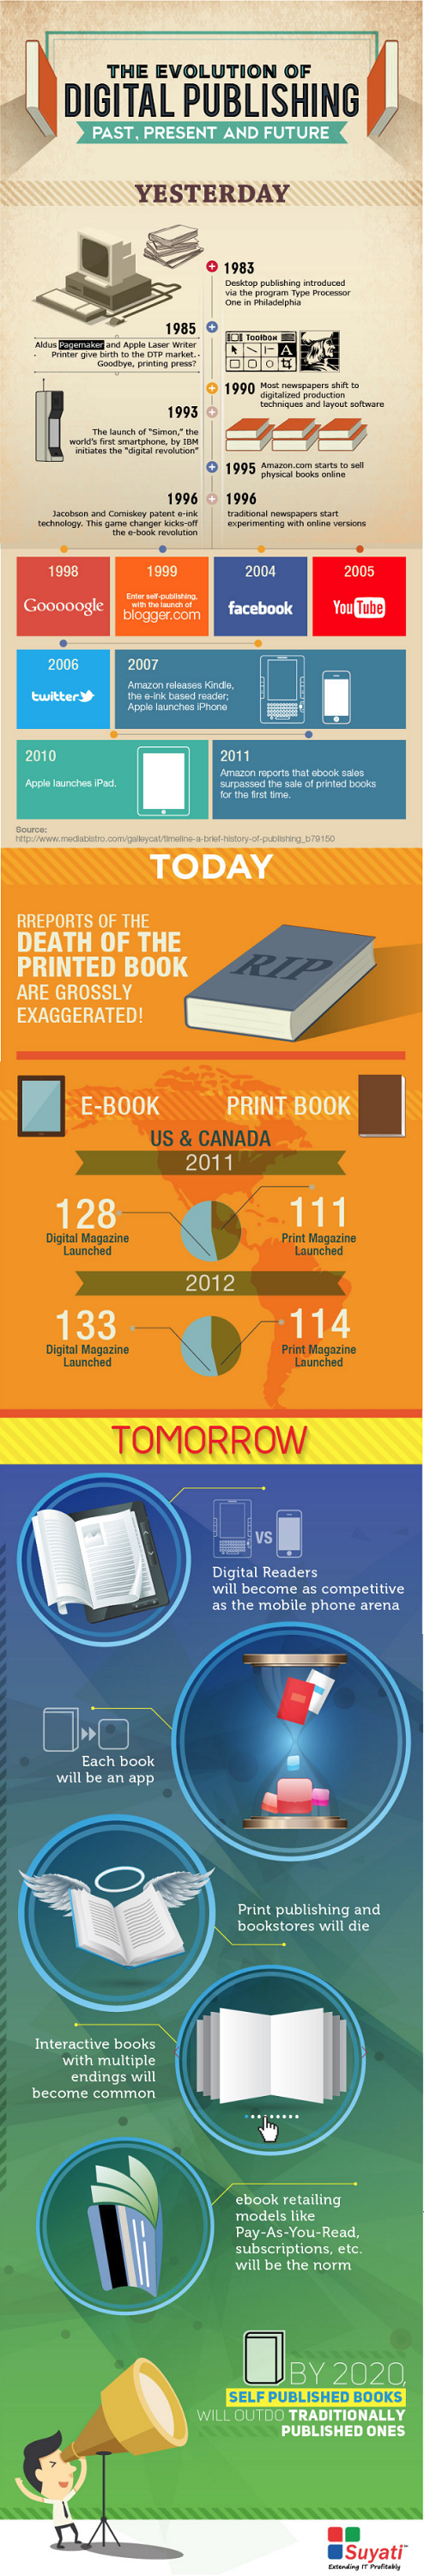
1. A look into the past, present, and future of online publishing
The good folks over at Suyati sure have a knack for compiling tons of data into a single, easily digestible format. Check out their infographic below. It crisply reviews the history of digital publishing, provides some relevant contemporary data, and boldly predicts the future of the industry.
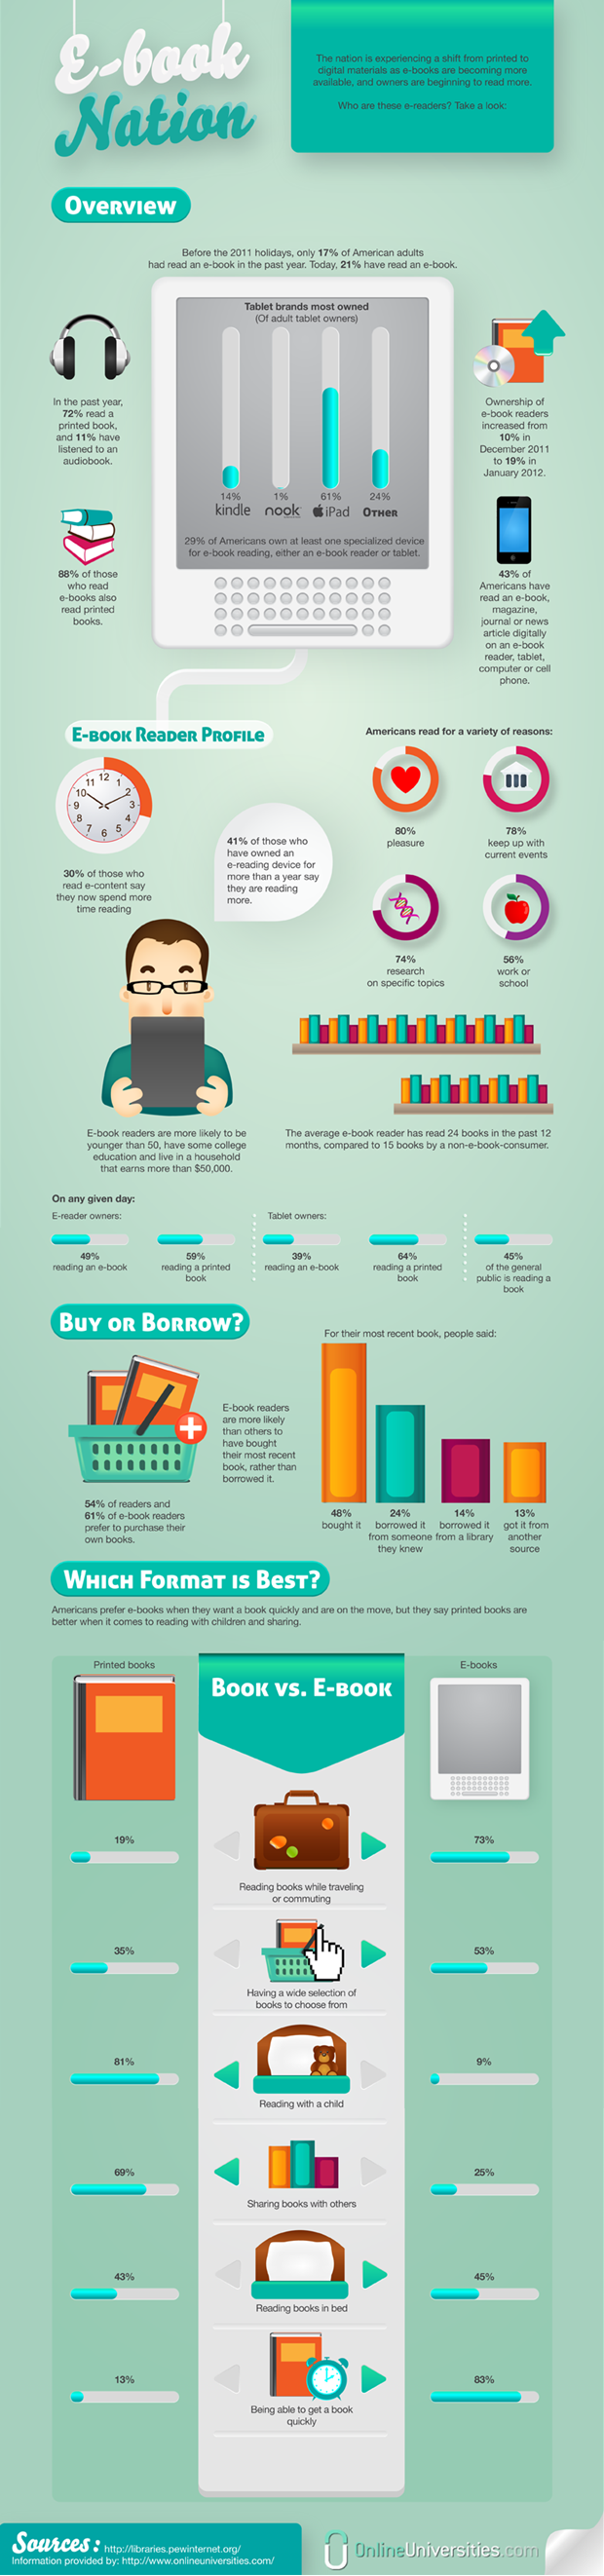
2. The Rise of E-Books "E-Book Mania"
We came across this wonderful infographic from OnlineUniversities.com. Their research is top-notch, and provides some really interesting data on electronic vs. print book consumption. It’s a must-read for any publisher looking to expand his or her horizon via a digital format.
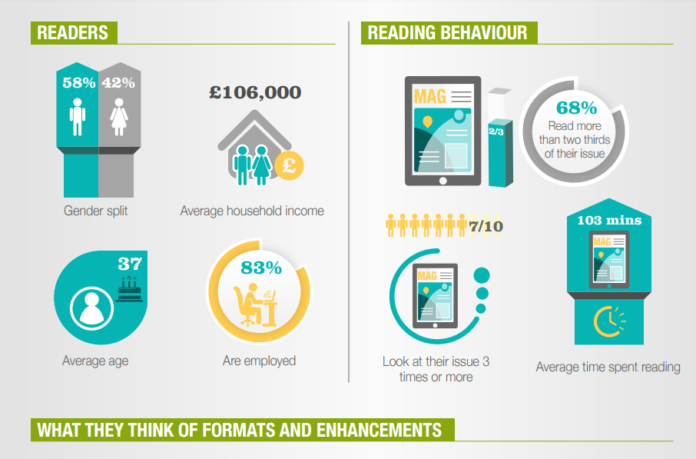
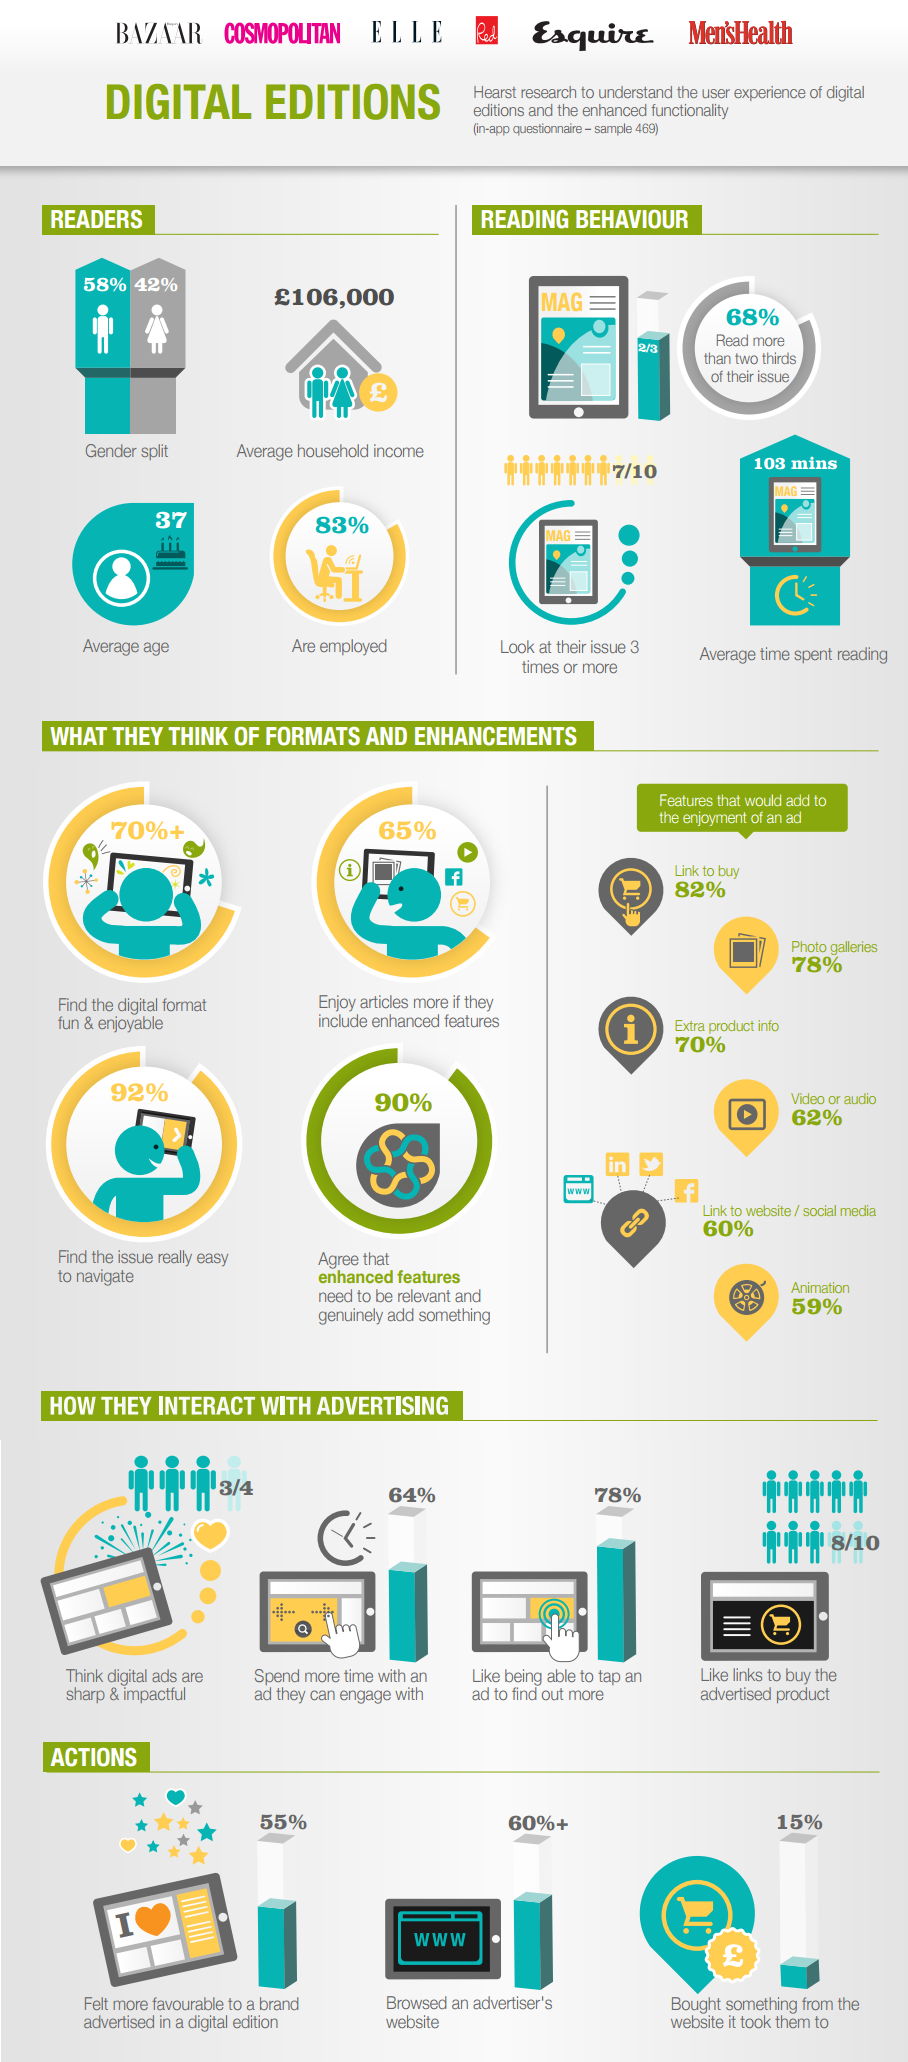
3. Understanding Digital Consumer Behavior
Kudos to InPublishing.com for this one. It’s a fascinating engagement study highlighting how consumers are interacting with digital magazines. More specifically, it explores how digital interactivity and advertising influence reader behavior. As it turns out, investing in digital ads is super important. It can elevate the e-reading experience and encourage readers to buy more (if done correctly).
There’s no better way to pack tons of information into an aesthetically-pleasing format than infographics. And the 3 we’ve shared with you here are proof of that. But if we missed any that you feel also deserve an honorable mention, share them with us. We want to see them all!
FAQ
1. Why is Average Session Duration more important than page views?
Answer: Average Session Duration shows how engaged readers are, unlike page views which can be inflated. It tells us exactly how long readers spend on content, helping publishers understand what content resonates with their audience.
2. How does focusing on Average Session Duration help publishers?
Answer: Focusing on Average Session Duration helps publishers create more engaging content that keeps readers interested. It also helps in demonstrating the value of content to advertisers by showing tangible engagement metrics.
3. Why are analytics crucial for digital publishing strategies?
Answer: Analytics, like Average Session Duration, provide detailed insights into reader behavior, guiding content creation and marketing decisions. Platforms like Joomag offer comprehensive metrics, enabling publishers to measure engagement accurately and tailor content effectively.


